Research Question: Does the type of soups, of similar mass affect the velocity it has as it rolls down a ramp (96cm) of a set height(25.5cm).
Claim/Evidence/Reasoning:
Various types of soups with similar masses will roll down a ramp of a set height and length at different speeds, or velocities. As I found out with time recording (stopwatch) and computer software (traker) I concluded that different soups will roll down a ramp at a different speed, or velocity. The different soup cans, Cream of Mushroom(A) , Chicken Noodle(B), and Tomato Soup(C) all rolled down the ramp at different speeds. Can A rolled down the ramp within 1.53 seconds, Can B rolled down the ramp within 1.33 seconds, and Can C rolled down the ramp within 1.13 seconds. This shows that Can A traveled down the ramp at a speed of 62.75cm per second, Can B traveled down the ramp at a speed of 72.18 cm per second, and Can C traveled down the ramp at a speed of 84.96cm per second. The graphs below are self-explanatory. Through this form of research I came to the conclusion that different soups of similar masses roll down a ramp at different speeds. The reasoning behind that soups of similar masses roll down at different speeds is that the soups have different viscosities. Viscosity is the state of being thick, sticky, and semi-fluid in consistency, due to internal friction. The tomato soup through the use of the evidence above, shows that it has the highest viscosity, whereas the chicken noodle soup has the least Viscosity, and the cream of mushroom soup has a viscosity in between the other two. The speed at which the soups came down the ramp is similar to the order of how much viscosity is has. The more viscosity means the longer it takes to roll down the ramp.
Evidence:
|
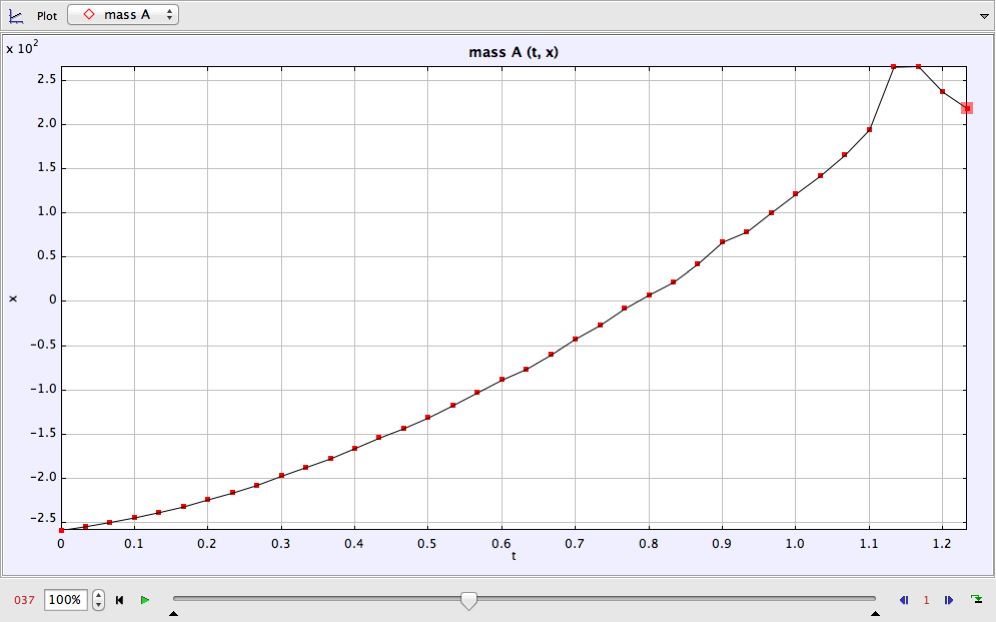
Cream of Mushroom Soup:
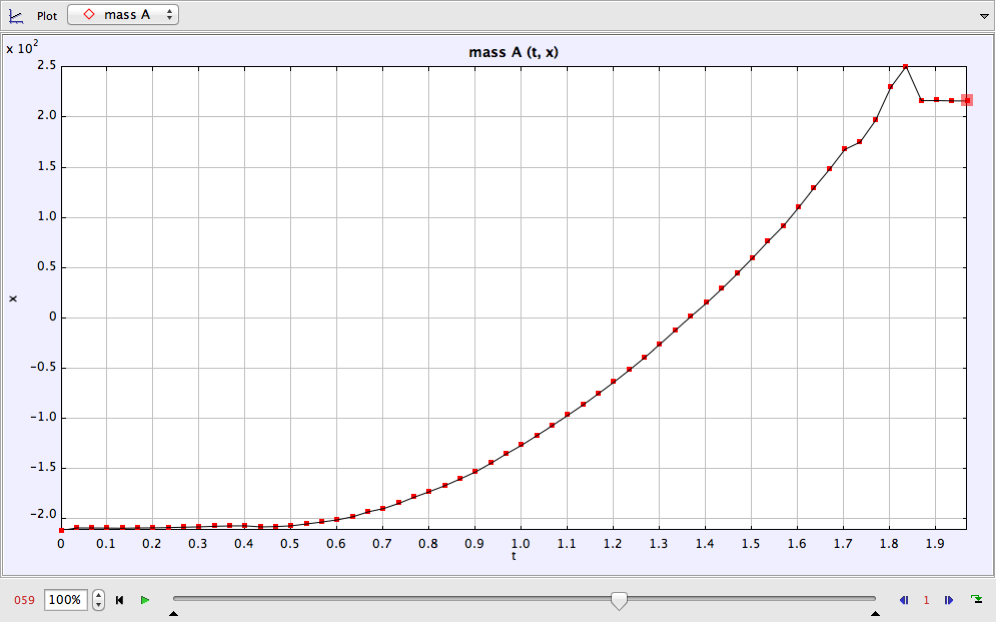
Position Vs. Time:
Velocity X-Component: 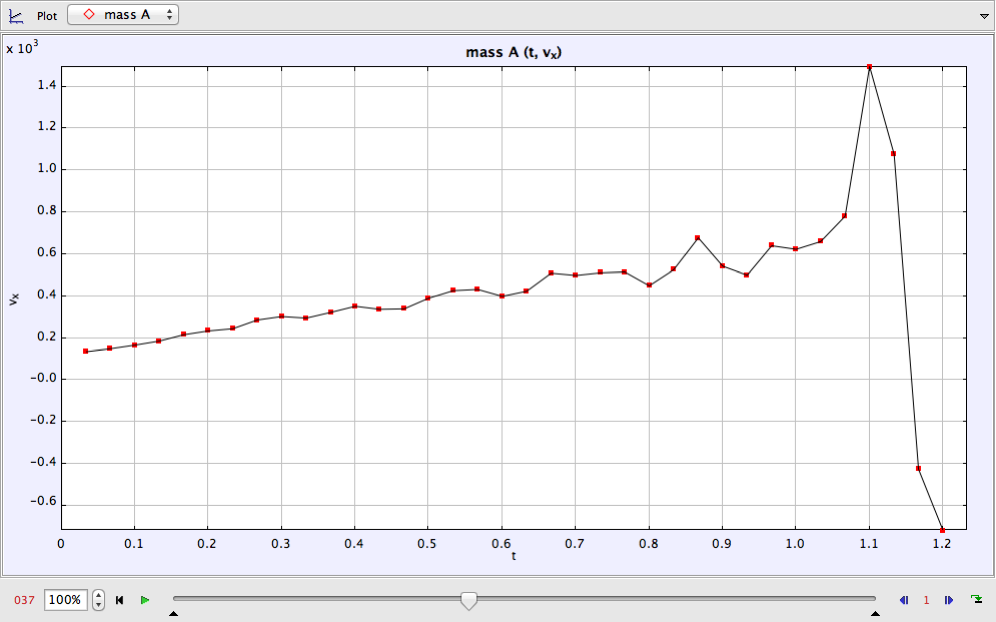
Velocity Y-Component: 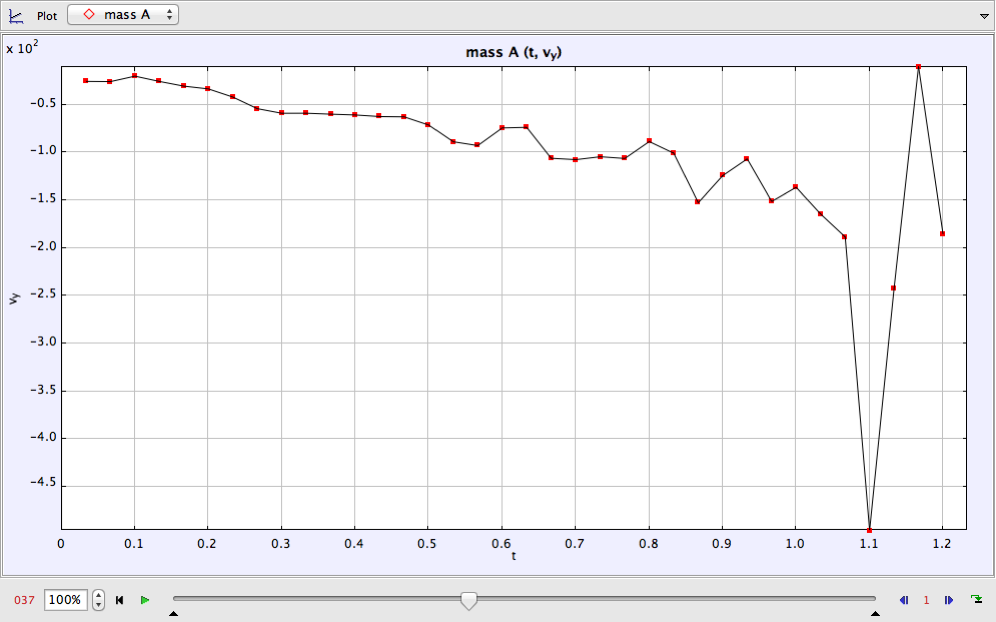
|
Tomato Soup:
Position Vs. Time:
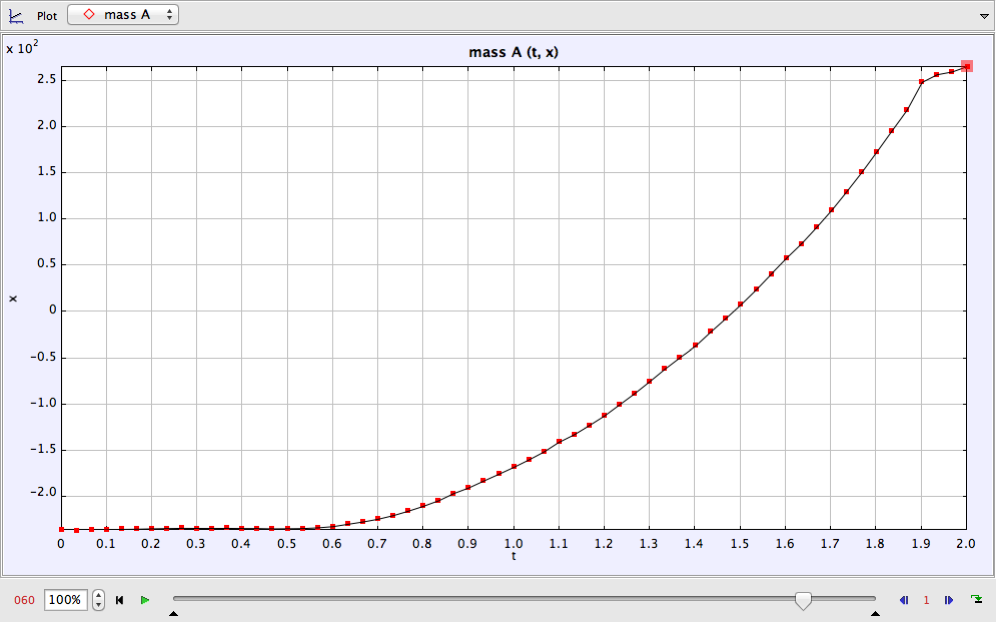
All three of the Position Vs. Time graphs for the different soups all have a similar curve. This shows that they were going at a near similar speed.
Velocity X-Component: 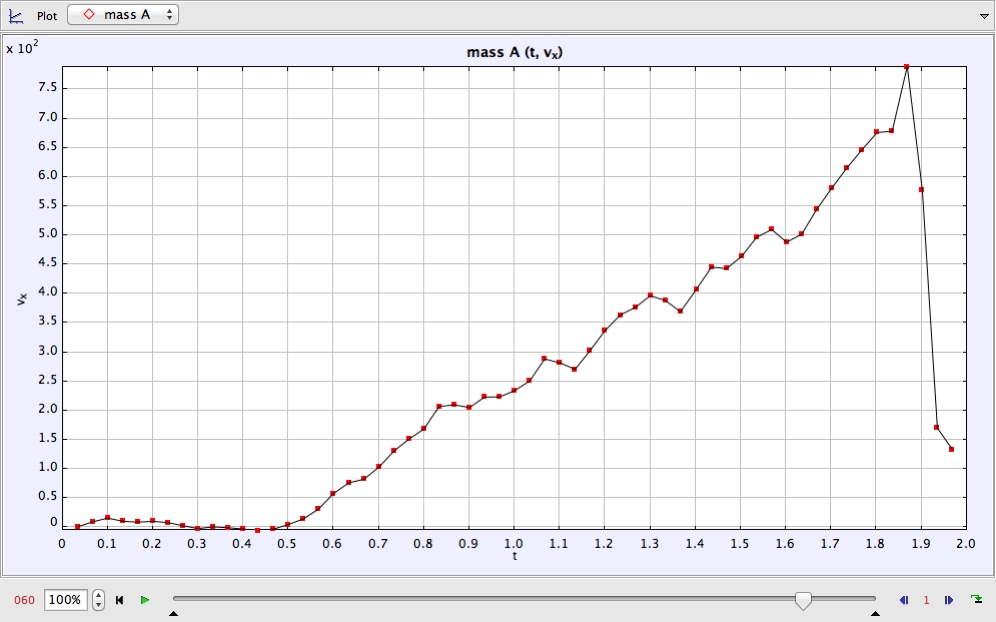
All three of the Velocity X-component graphs have a different upward motion. This shows that they all had a speed increase but at different increments.
Velocity Y-Component: 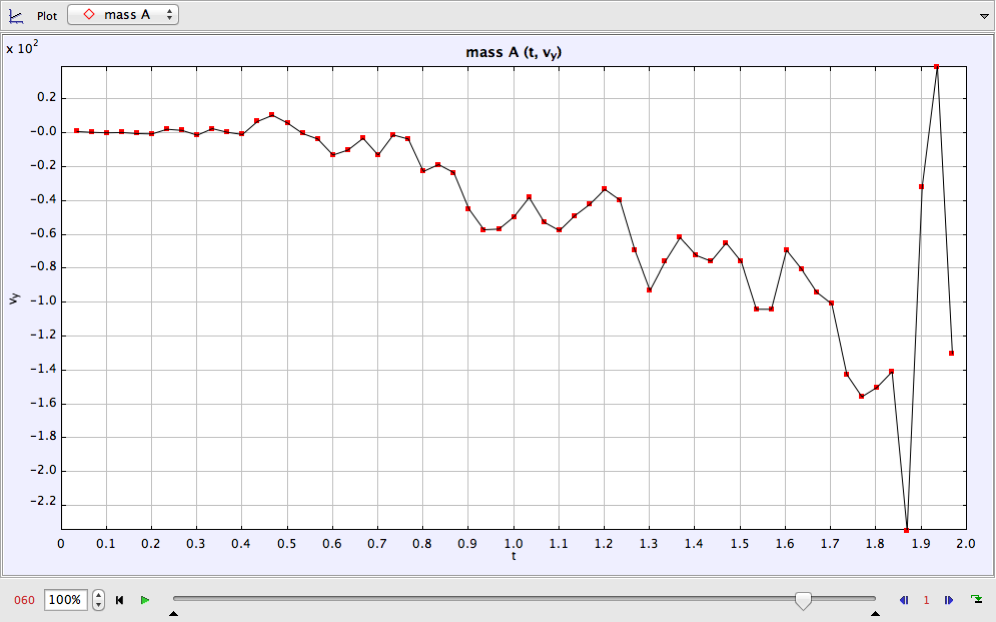
All three of the Velocity X-component graphs have a different downward motion. This shows that they all had a speed change but at different increments.
|
Chicken Noodle Soup:
Position Vs. Time:
Velocity X-Component: 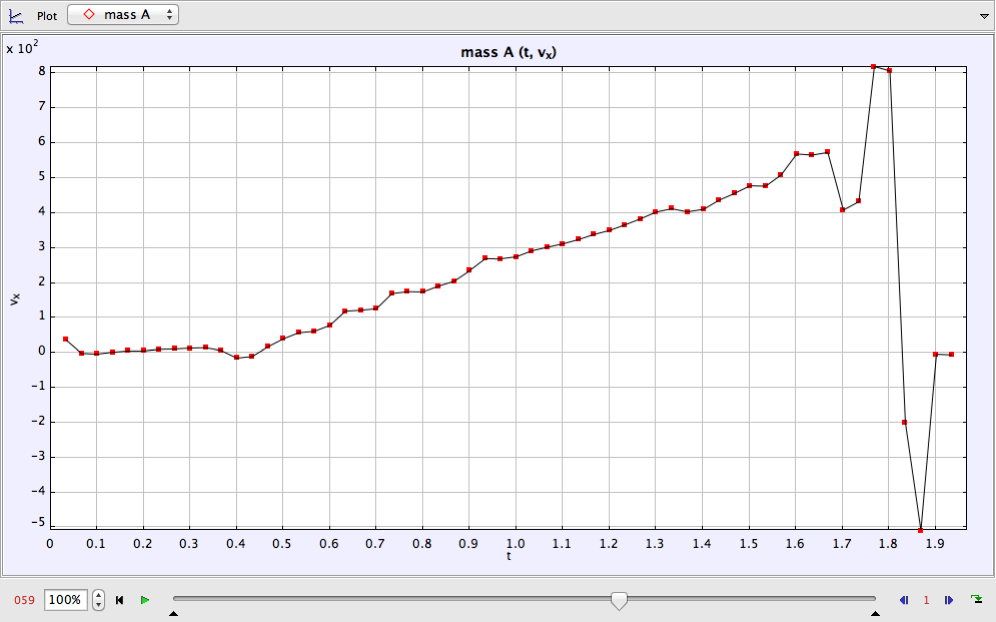
Velocity Y-Component: 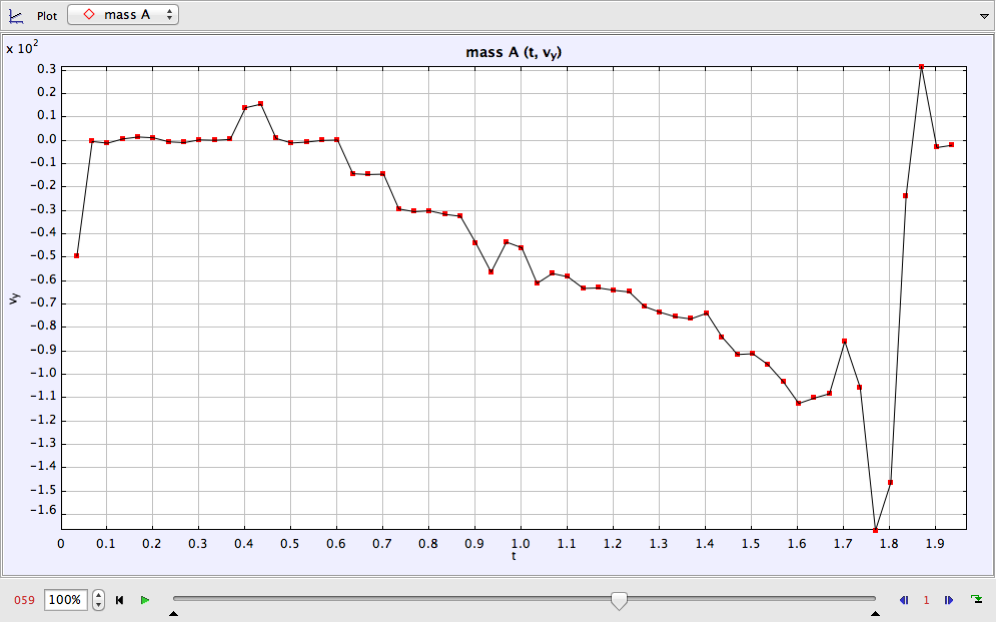
|
